I came across this topic while doing some research on The Wheel options strategies, where I watched some videos from the channel of Markus Heitkötter. He mentioned that, while trading various options, a look at the portfolio correlation matrix is useful to balance risk.
What is a correlation Matrix
First, a correlation is a meassure for two (or more) (time) series on how connected the signales are with each other. This means, if series A goes up (increases in value), so does series B. If the two series move in lock step, a correlation of 1.0 is reached. If they anti-correlate, this means that when series A moves up, series B moves down.
A correlation matrix is simply a way of visualizing this concept in a N x N matrix style (given N series to analyze). While this is applicabe to all kinds of series, I’d like to address it in the scope of various time series, especially for the stocks market.
Examples
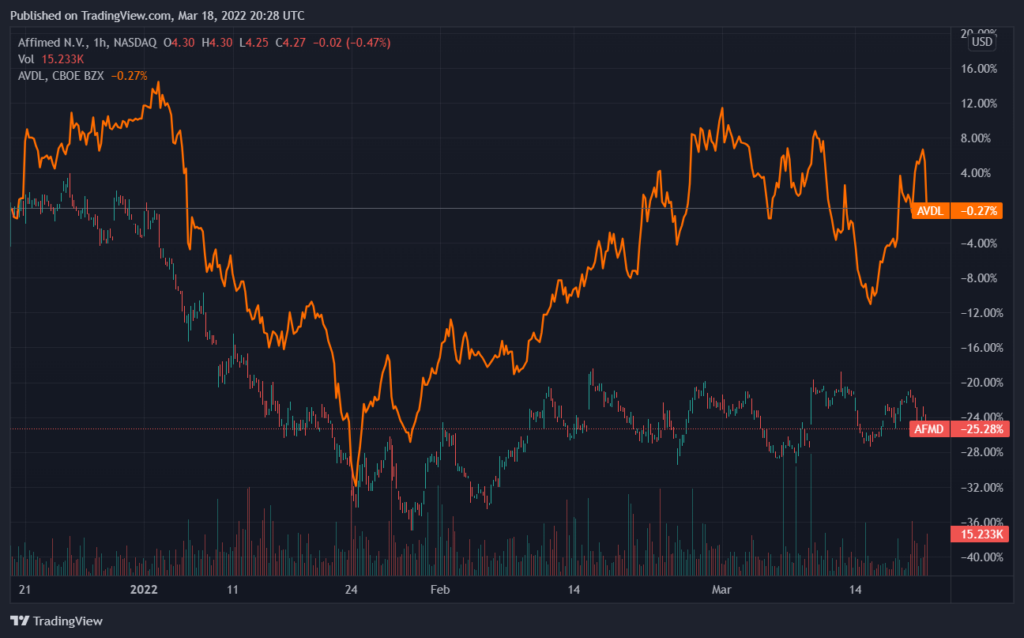
For two assets, say AFMD and AVDL, we can have a look at the charts over the last three months:

You can see, that these two stocks move somewhat correlated over time: if AFMD goes down, so does AVDL and vice versa.
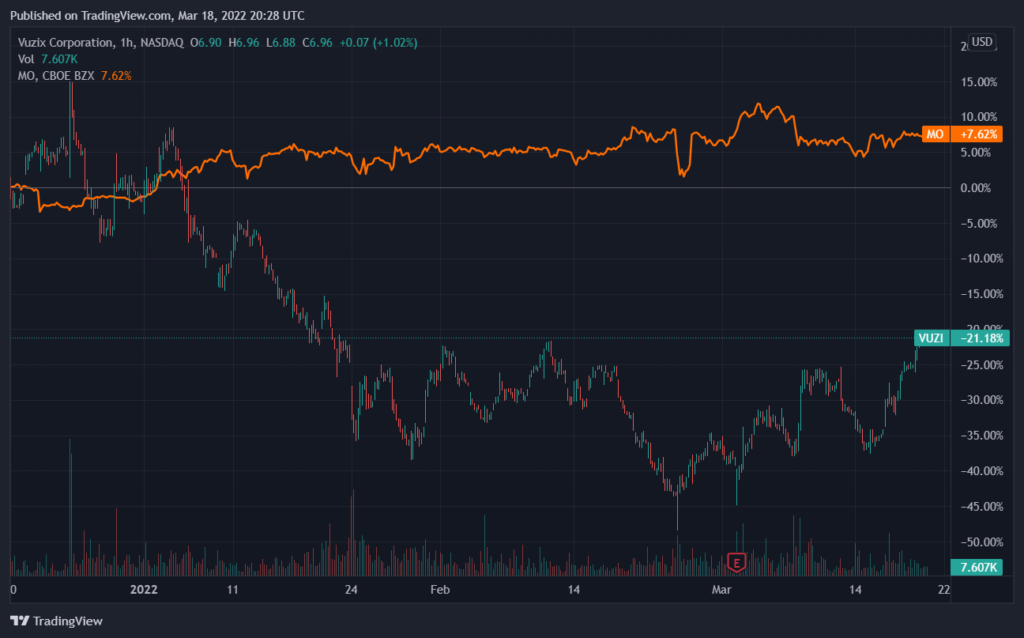
Compare this behaviour to the stock prices of VUZI and MO:

Here we see, that if VUZI goes down MO moves up (not a one-to-one match, but quite good).
Putting these patterns into numbers means calculating their correlation coefficients. In this example the correlation coefficient is -0,82.
Why is the Correlation Matrix important for trading The Wheel options strategy?
When trading The Wheel, we sell options on one or more than a single stock. Say you have 10.000€ in your account. Then you can sell cash secured puts for stocks in exchange value of 10.000€ (your collateral needed). You can reach this blocked collateral in selling 1 put option (equals 100 shares) for a strike price of 100€ or two options for two different stocks with strike price 50€ each and so on.
You may want to balance your wheel portolio such, that in case the market moves, you will not get assigned with all your puts / calls in case the movement is against your favour. Having tightly correlated assets only in your portfolio is unfavorable.
N. B. I’m fine with every outcome of a trade: either I keep the premium and the option expires OTM or I keep the premium and get assigned 100 shares / sell 100 shares (which I already own). This is a great advantage of The Wheel options strategy.
Stocks Correlation Matrix in Python
For calculating stocks correlation matrix with python we have to do two things:
- Get historical data, e.g. close prices
- Do the math / let a library do the math
Pandas has the build in function .corr() on a DataFrame to calculate the correlation matrix of all the columns in the dataframe. All we have to do as pre-processing is to merge the different asset prices on the date index. We do this, because we want to ensure to compare the values of Series A on Date X to match the values of Series B on Date X.
import yfinance as yf
import pandas as pd
import matplotlib.pyplot as plt
import seaborn as sn

tickers = ['MO', 'AVDL', 'AFMD', 'SFM', 'KO', 'HPQ', 'INTC', 'VUZI', 'CLNE', 'IRNT']

df = pd.DataFrame()
for ticker in tickers:
    ticker_yahoo = yf.Ticker(ticker)

    data = ticker_yahoo.history(interval='1d', period='3mo')

    col_names = data.columns
    data = data.drop(['Open', 'High', 'Low', 'Volume', 'Dividends', 'Stock Splits'], axis=1)
    data = data.rename(columns={'Close': ticker})

    if df.empty:
        df = data
    else:
        df = pd.merge(df, data, left_index=True, right_index=True)

corrMatrix = df.corr()
sn.heatmap(corrMatrix, annot=True)
plt.show()
What the code does
First we loop over the ticker symbols and get the data via yahoo finance api. We then drop not needed columns and rename the temporary dataframe’s column to the ticker symbol (so we have these symbols as columns and rows in the portfolio correlation matrix). After that, we merge the dataframe with the previous one.
We took the last three months of data (parameter period='3mo'), as this is somewhat suitable for The Wheel, where we typically sell options with expiration up to 15-60 days from now. The interval is set to 1d, which means that we look at daily closing prices for the correlation matrix.
Finally we calculate the correlation matrix and plot a visualization of it with the seaborn package. The results look as follows.

We now have an overview of our portfolio correlation matrix done with python. E.g. VUZI and KO anti-correlate (coefficient -0.57), meaning if VUZI goes up, KO tends to go down. Where SFM and CLNE have a positive correlation (0.66).
Thanks for sharing your thoughts!
Thank you!